

When Do Markets Bottom?
There is a lot of guesswork on where this bear market will ultimately bottom. Guessing is not really a valuable spend of time in my opinion because seeing into the future is not possible. My goal is not to sound smart, my goal is to adapt to markets and buy great businesses with strong profitability and FCF generation and that have long runways for growth ahead. When I can get them on sale, I like it even better. 2022 has been a painful year for the long-only crowd but we have not seen sales on great companies like this year in a very long time. As Apollo Management likes to say, the best returns come when you buy at low prices.
Traders do not like to buy stocks under the 200 day moving average because “bad things happen under the 200” but if you have some duration, you should want to see your favorite companies trading low so you can accumulate more shares. It’s not rocket science. Only in this industry does great merchandise on sale NOT intrigue shoppers. Probably the silliest thing I have ever seen. Check your emotions at the door while investing, they have no place in this room.
The current consensus thinking goes something like this: stock markets fell, multiples fell because inflation was high, interest rates were rapidly rising, the Fed was aggressively normalizing policy rates which had a big impact on the dollar rising. So stocks fell hard on these macro data points and have stabilized for now. The next shoe to drop they say, is the earnings slowdown/recession that is inevitable in 2023. All very logical views in my opinion.
The real question: Do markets discount a recession TWICE (2022 and then again in early 2023 as earnings begin to reflect what markets know already) or do stocks fall all at once incorporating all the bad news by connecting today’s dots of inflation, multiples re-setting, and an eventual fall in earnings while finally putting in a more lasting bottom well in advance of the actual earnings degradation? This is literally the most important thing playing out in markets today. Everything else is just click-bait in my opinion. Certainly, if the news flow continues to get worse, aka more systemic issues from FTX fallout or war in Ukraine, etc, markets can react to the news cycle but ultimately earnings drive the future of stocks and stocks fall in advance of falling earnings and bottom well in advance of the final earnings trough.
Since we know we can’t predict the future with anything better than 50/50 odds, let’s look at some former bear market periods as examples of this thesis to see if we can spot any patterns that help better our odds of understanding the future. These charts came from a recent JPM “Eye on the Market” report from Michael Cembalest, a very good strategist. I’ll cut to the conclusion for those that don’t want the history lesson. Here’s what Cembalest says about our market today and the potential bottom in stocks:
“As for the latest bear market, I see no reason why this cycle will not end up looking like most of the other ones. If so, the bottom in equities will occur even as news on profits, GDP and payrolls continues to get worse. When will that be? We will be watching the ISM manufacturing survey very closely. It has a good track record of roughly coinciding with equity market bottoms, as shown in the table. I would consider 3200-3300 on the S&P 500 index good value for long term investors, if such levels were reached sometime this fall/winter.”
My thoughts: If markets tend to bottom BEFORE the profit, GDP and payroll data bottoms and we reasonably expect earnings troughs to be somewhere around the April earnings period (better companies will see fundamentals fall less and stabilize faster, others will take longer), then somewhere around here to early Q1 should be where equities find a more lasting bottom. That will help sentiment mightily which could speed up the recovery in alot of other areas and create a major positive feedback loop we haven’t seen for a year. Maybe the market bottoms coincident to the Feds last rate hike, I have no special skills to guess, but it seems the clock is ticking on an equity bottom based on price and the tendencies for a bottom to occur before the fundamental data bottoms.
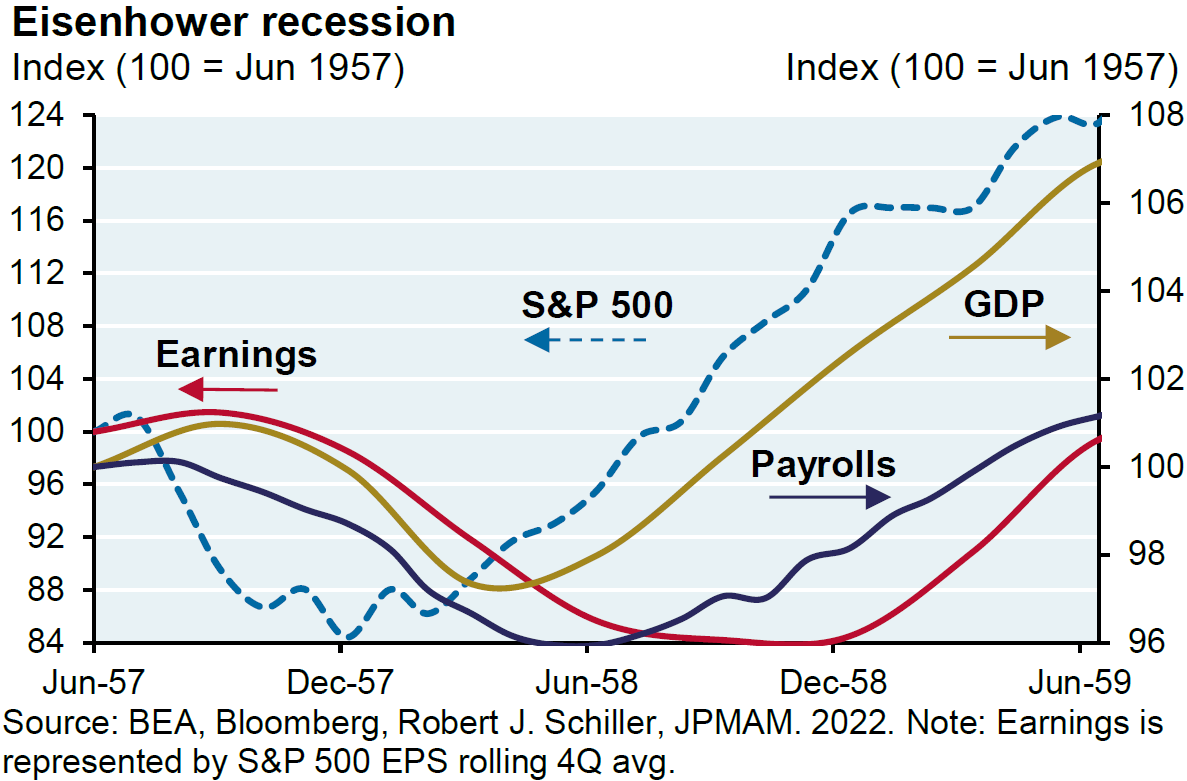
Period #1: The Eisenhower Recession June 1957 to June 1959 period
In this period, the S&P fell roughly 17% from June 1957 to the trough for the market year end 1957. Earnings started to roll over AFTER the market as we would expect. Earnings didn’t trough until the Q3/Q4 1958, almost a full year AFTER the market bottomed. The overall GDP trough came 6 months AFTER the market bottomed. The payroll trough came just before the earnings trough. From the S&P trough in late 1957 to June 1959, the S&P rose about 47% in about 18 months.
In this example: the market bottomed well before the earnings, payroll and GDP data did.
Period #2: The Stagflation period of the 1970’s: The June 1973 to December 1976 period
In this period, the S&P fell roughly 38% to the double bottom trough for the market year in Q3/Q4 1974. Interestingly, earnings kept rising as they are likely doing today because of inflationary pricing and did not peak until roughly the market bottomed in late 1974. Earnings gently fell for about 9 months before rebounding back to all time highs by year end 1975. The overall GDP trough came 5-6 months AFTER the market bottomed. Payrolls peaked about the time when earnings peaked, aka around the same time as stocks bottomed. Payrolls fell fairly sharply and bottomed a few months before earnings bottomed and again, went on to all time highs by the end of 1976. From the S&P trough around December 1974, the S&P rose about 55% over the next 24 months.
In this example: the market bottomed about the same time as earnings & payrolls peaked and about 3-4 months before the trough in overall GDP. Lets call this period more similar to today’s environment. Perhaps that’s what we see this time?

Period #3: The Double-Dip recession period of the 1980’s: The December 1980 to Q1 1985 period.
In this period, the S&P fell roughly 20% over an 18 month period to the trough around mid 1982. Similar to today, there was a massive demographic group just beginning their earning and spending cycle, let’s call them the Baby Boomers. Today, it’s the Millennials and they are slightly larger than the Boomers and have another generation after them just as big, these are GenZ. So we have 2 generations, both larger than the Boomers just beginning their spend/earn/save cycles. That’s NOT bearish folks. Granted, today the standard of living is much less attractive as Boomers bought houses at 14-30k and now those homes are $400+k, etc.
Earnings kept rising as they are likely doing today because of inflationary pricing and did not peak until roughly 6 months before the market bottomed. Earnings rolled over and bottomed roughly 6 months AFTER the market bottomed then recovered nicely past the former peak. GDP was volatile but didn’t really fall that much during this period and bottomed around the same time as the market. Payrolls peaked about the time when earnings peaked, and both bottomed AFTER markets bottomed. From the S&P trough around Q3 of 1982, the S&P rose about 56% over the next 36 months. Importantly, the S&P ripped straight up from the bottom for the next year until the market saw about 12% pullback the following year but recovered all those gains 6 months later.
In this example: the market bottomed about 4-6 months BEFORE earnings, and payrolls and coincident with GDP. Again, let’s call this period more similar to today’s environment with inflation & double dip potential. Perhaps that’s what we see this time?

Period #4: The S&L crisis of the 1990’s: The December 1989 to about mid 1993 period.
In this period, the S&P fell roughly 15% over a roughly one year period to the trough around late 1990. Earnings rolled over just about the same time as the market was bottoming and earnings didn’t trough until about January 1992! Payrolls bottomed about 9 months AFTER the market bottomed as did GDP.
Earnings and payrolls crawled along the floor for about a year but GDP and the stock market recovered much quicker. From the trough market level around late 1990 to the middle of 1993, the market rose about 47-50% by my eyes.
In this example: the market bottomed about 12 months BEFORE earnings, and ~6 months before payrolls which was similar to the GDP trough.

Period #5: The Dot-Com Bubble recession beginning December 1999 to Q1 2004
Here, I’ll quote Cembalest: The Dotcom collapse is the outlier: “the earnings decline preceded the equity market decline, there was barely a recession at all, and the mini-recession of 0.3% preceded the equity market bottom by more than a year.”
Value stocks did quite well in 2000-2001 before 9/11 happened then we had a short, shallow recession and stocks bottomed in Q1 2003 while earnings bottomed much earlier. That period seems more unique versus all others, other than high valuations for the tech sector.

Period #6: The Financial Crisis: The early 2007 to early 2013 period.
In this period, the S&P fell roughly 40% from late 2007 to March 2009. Consumers were over-levered, flipping houses using no-doc loans and the housing market was on fire. Earnings rolled over just before the market began its fall. The market bottomed in March 2009 while earnings bottomed about 6 months later. GDP bottomed right about the same time as the market in early 2009. Payrolls bottomed about a year AFTER the market.
From the trough market level in March 2009 to the forward 12 months, the market rallied about 40% and the market rallied roughly 110% from the lows in 2009 to around Q1 2013.
In this example: the market bottomed about 6 months BEFORE earnings, just before GDP and about 9 moths before payrolls.

Period #7: The Global pandemic period of December 2019 to peak market in late 2021.
This was such a catalyst driven market crash so it’s hard to make too much out of the data but let’s see what happened. In this period, the S&P fell roughly 30% rather quickly as fear, uncertainty, doubt, and misinformation was rampant. Consumers were paid to sit at home and shop online while not working much. Earnings rolled over with a lag and didn’t bottom until 9 months AFTER the market. Payrolls dropped off a cliff for a period of time but bottomed a few months after the market. GDP bottomed about 6 months after the market as well. With stimulus and Fed free money, everything recovered much faster than most believed possible in the depths of the pandemic.
From the trough market level in late March 2020 to the forward 12 months, the market rallied about 45%+ and just kept on going until the peak in late 2021 when we started to see inflation rise and multiples begin to contract. Now we are seeing what appears to be PEAK inflation and PMI prices and markets appear to be stabilizing, are still above their recent lows and have positive seasonality into the year end. The Fed is still on everyone’s radar but for me, thats old news. EVERYONE expects earnings in 2023 to be negative and for a recession to arrive.
In this example: the market bottomed about 9 months BEFORE earnings.

Period #8: Our current high inflation, Fed policy normalization bear market starting in June 2021 to November 2022
Poor Fed policy, poor Covid response policy, and an over-stimulated US economy drove today’s inflationary bear market. Valuations were high, interest rates were far too low for far too long, and the cost of capital was far too low for far too long which created all sorts of misallocations of capital. Zombie companies that never should have been created will continue to float to the surface as interest rates normalize and monetary policy stays tight. Long-term thats a good thing, shorter term, it offers a rocky road. The good news: great businesses are already on sale and may continue to be put on sale for a bit longer. The Fed has stated their intention of pushing Fed Funds to 4.75%-5.25% before sitting on hold for a while. As inflation comes down, they will be lowering rates to keep the delta between rates and growth at appropriate levels.
Thus far, equities have fallen anywhere from 15-40%, with the average stock pulling back a whopping 40% from the all-time highs. A lot of damage has already been done. I generally agree with Cembalest’s assessment (I’m less focused on levels versus entry points for our favorite brands) as his conclusion so I’ll just post it here:
“I see no reason why this cycle will not end up looking like most of the other ones. If so, the bottom in equities will occur even as news on profits, GDP and payrolls continues to get worse. When will that be? We will be watching the ISM manufacturing survey very closely. It has a good track record of roughly coinciding with equity market bottoms, as shown in the table. I would consider 3200-3300 on the S&P 500 index good value for long term investors, if such levels were reached sometime this fall/winter.”
In this example: We do not know if markets have yet to make their final bottom but there’s already been major damage to sentiment and equity prices. Valuations have been re-set. Earnings began to ease in Q1 of this year, payrolls have not begun to fall but with layoff announcements, we should see that next. GDP peaked about the same time as earnings.

Disclosure:
This information was produced by Accuvest and the opinions expressed are those of the author as of the date of writing and are subject to change. Any research is based on the author’s proprietary research and analysis of global markets and investing. The information and/or analysis presented have been compiled or arrived at from sources believed to be reliable, however the author does not make any representation as their accuracy or completeness and does not accept liability for any loss arising from the use hereof. Some internally generated information may be considered theoretical in nature and is subject to inherent limitations associated therein. There are no material changes to the conditions, objectives or investment strategies of the model portfolios for the period portrayed. Any sectors or allocations referenced may or may not be represented in portfolios managed by the author, and do not represent all of the securities purchased, sold or recommended for client accounts. The reader should not assume that any investments in sectors and markets identified or described were or will be profitable. Investing entails risks, including possible loss of principal. The use of tools cannot guarantee performance. The charts depicted within this presentation are for illustrative purposes only and are not indicative of future performance. Past performance is no guarantee of future results.