Powerful Demographic Trends Can Drive Secular Portfolio Performance

Roughly 4 billion Millennials and Gen-Z globally offer massive tailwinds to certain brands.

Key Points

  • Demographics play a key role in identifying important consumer trends & themes.

  • Millennials and Gen-Z now make up a large portion of the global population.

  • The brands that are loved by this cohort have a multi-decade runway of growth ahead.

Demographics Matter.

In the early 1980’s, the Baby Boomers were just beginning their saving, spending, and earning cycle. The youngest Boomers were roughly 35 years old just as the stock market and real estate markets began a new and lasting bull market. To be sure, the cost of living today for Millennials versus the early 1980’s is radically different but directionally, the same trends will happen for today’s younger generations but with certain nuances. As an investor in consumer trends and habits, we must analyze today’s trends so we can map back to the brands that should benefit most. Today’s younger generations make more money versus the Boomers, but everything costs much more, our dollars don’t go as far as they once did. A bigger, and more potentially damaging issue we face today; younger adults are not having as many babies as the Boomers or their parents. That’s a long-term issue for many countries. Additionally, younger adults are having kids later in life, having less kids, and therefore spending more time and money on themselves. Experiences are very important to Millennials and Gen-Z, which means the services sector will play a key role in serving this massive group of consumers. Within portfolios, we believe there’s a key allocation to “selective indulgences” that must be made, and our research indicates most portfolios are underweight many of the leading brands that stand to benefit the most. Example: the luxury goods sector. Millennials are the key buyers of aspirational, differentiated luxury products around the world and given their age and future income potential, it leads us to see a very bright future for the brands that make these products. LVMH, Hermes, L’Oreal, Tesla, and Ferrari are just a few brands that appear to have wonderful tailwinds on a secular basis, particularly within Asia. Collectively, Asia has ~2 billion consumers that fall in the Millennial and Gen-Z cohort. They are digitally native, highly brand aware, and are passionate about aspirational brands.

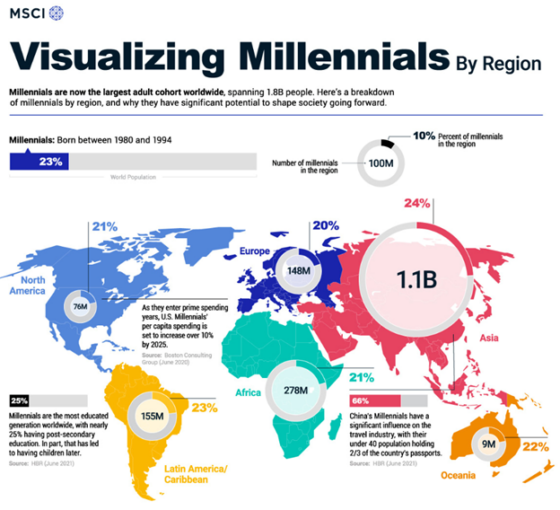
Millennials are the largest population cohort on the planet at roughly 1.8 billion people.

Here’s a great visual showing where this important cohort resides around the world.

As you can see, you cannot ignore how Asian consumers (1.1 billion in size) think and spend if you are investing in the Millennial-focused consumption theme. This cohort loves luxury brands, and they love experiential luxury. Additionally, Millennials are the most educated population cohort which means they have higher lifetime earning potential. As you know, there is a very high correlation between education and earning potential. And when you make more, you spend more, that has not changed from generation to generation.

One concept we think the media will begin focusing on is how U.S. and China relations evolve over time and how it will affect the consumption habits and brand love of consumers. Our view is quite different than consensus currently and we think over time, consensus will move in our direction. Because of poor relations between the two largest countries in the world and because of increased nationalism, we think it will get harder to build a brand in China and some U.S. brands operating in China could see an erosion of brand value as European brands become more popular as well as more Chinese and Asian brands rise in popularity.

To be clear, we think brands like Apple, Starbucks, and Nike have deep roots in Chinese culture but for smaller U.S. brands trying to make inroads, we say caution is advised. The government of China wants its own brands to be the dominant beneficiaries of consumption trends and when you have a centralized government with policies that have zero-tolerance, trends can change over a long period of time. To be clear, this is a slow-moving train but as a capital allocator, we must be mindful of trends like these as we make investments. The important key here: we believe the major net beneficiary of poor U.S. and China relations should be the ex-U.S. brands like Lululemon and leading European Brands like LVMH, Hermes, Ferrari, Kering, Moncler, and others.


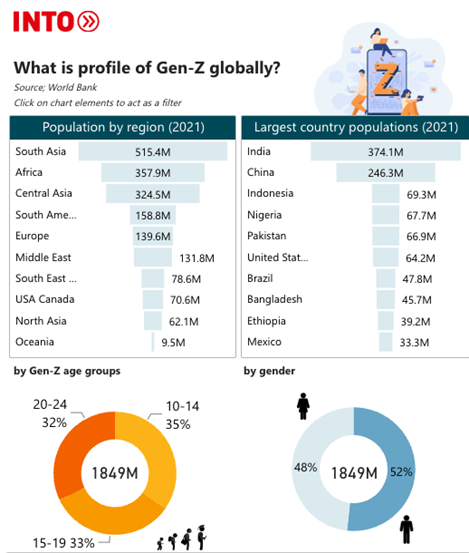
 Gen-Z, similar in size and a source of strong future consumption opportunities.

It’s quite rare to have two back-to-back generations larger than the last big population cohort. Baby Boomers and their spending had an outsized effect on the stock market and real estate markets so it’s quite difficult for us to be bearish long-term given the powerful spending tailwinds from these two population groups. No one can predict the future and the business cycle always matters but the moral of the story is this; when you see bouts of weakness, that’s simply an opportunity to build bigger positions in the companies and Brands that serve this important mega trend.  People forget, massive secular themes tend to bail investors out even if their investment timing is poor. The greatest businesses serving the largest trends will always have buyers, particularly if/when these stocks go on sale.

Gen-Z, in many ways, will be more productive workers than their Millennial counterparts, partly because their parents were the forgotten generation, Gen-X. Gen-X is the dominant spending cohort in the U.S. today and they generally grew up more independent which makes this group more resilient and resourceful. Gen-Z will benefit from this hard-working cohort as parents. A key attribute of Gen-Z is mobility. This is the first generation that is fully digitally native. The phone is everything. Working Wi-Fi is more important than a working bathroom! They love Snapchat and Facetime. They will be huge consumers of e-commerce. They may not go to college to the degree Millennials did, they see value in alternative sources of education. Experiences matter for this cohort as well which makes the services sector a very important investment opportunity. Good or bad, this generation loves TikTok, Discord, Snap, Instagram, Spotify, Shein, Apple, DoorDash, Reddit, and Vans to name a few.

Again, it’s Asia that investors really need to focus on here. India and China are key regions for consumption opportunities. With global brands setting up more and more manufacturing operations in India, the growth of the Indian consumer is likely one of the most robust opportunities for the long-term. U.S. and European brands are spending large amounts of time and money investing in these countries and attempting to build brand love and loyalty as aggressively as they can. Below, is a great graphic highlighting the Gen-Z population stats around the world.

Bottom line:

Along with Artificial Intelligence, consumption trends for Millennials and Gen-Z offer investors wonderful long-term gain opportunities. Understanding what drives each cohort and which brands they favor is very important to stock selection. Rest assured, we spend a ton of time on these trends and analyzing the brands that matter most.

As we sit today, these brands seem well positioned to capitalize: Apple, Meta, Google, Microsoft, LVMH, Hermes, Ferrari, Spotify, Nestle, L’Oreal, Estee Lauder, Live Nation, Airbnb, Booking.com, Nike, Lululemon, Visa, Mastercard, American Express, McDonalds, Mercado Libre, Amazon, Netflix, Costco, Uber, Target, Starbucks, Home Depot, Coke, Pepsi, Monster Beverage, and Tesla, to name a few. Our portfolios own a large portion of these and with better prices, we would love to own even more.


Disclosure:
The above report is a hypothetical illustration of the benefits of using a 3-pronged approach to portfolio management. The data is for illustrative purposes only and hindsight is a key driver of the analysis. The illustration is simply meant to highlight the potential value of building a consumption focused core portfolio using leading companies (brands) as the proxy investment for the consumption theme. This information was produced by Accuvest and the opinions expressed are those of the author as of the date of writing and are subject to change. Any research is based on the author’s proprietary research and analysis of global markets and investing. The information and/or analysis presented have been compiled or arrived at from sources believed to be reliable, however the author does not make any representation as their accuracy or completeness and does not accept liability for any loss arising from the use hereof. Some internally generated information may be considered theoretical in nature and is subject to inherent limitations associated therein. There are no material changes to the conditions, objectives or investment strategies of the model portfolios for the period portrayed. Any sectors or allocations referenced may or may not be represented in portfolios managed by the author, and do not represent all of the securities purchased, sold or recommended for client accounts.  The reader should not assume that any investments in sectors and markets identified or described were or will be profitable. Investing entails risks, including possible loss of principal. The use of tools cannot guarantee performance. The charts depicted within this presentation are for illustrative purposes only and are not indicative of future performance. Past performance is no guarantee of future results.

What the Largest, Smartest Investors See Going Forward

Excerpts from KKR’s Mid-Year 2023 Outlook Deck “Still Keeping it Simple”

Key Points from the perch of a consumer trends & global brands investor.

KKR Mid-Year Outlook: Summary

I’ve always believed watching what the smartest investors in the world are doing, offers the average HNW investor a wonderful advantage. The largest alternative asset managers, including the private equity and private credit firms, have an information advantage over the typical individual investor. Firms like Blackstone, KKR, and Apollo, collectively own over 500 companies around the globe. These companies employ millions of workers across virtually every sector. Having “boots on the ground” information helps these firms see around corners better than the rest of us. This advantage has historically translated into superior returns across the private investment funds they manage. That’s why we own the stocks of these great brands. Currently, all 3 stocks are on sale and offer attractive entries while paying dividends that will grow over time. Today, I want to deviate from the normal consumer trends note and summarize KKR’s newly released 2023 Mid-Year Outlook because it’s important for advisors to consider these ideas as they allocate. The full report is long, so I thought a summary would be helpful for those short on time.

Summary:

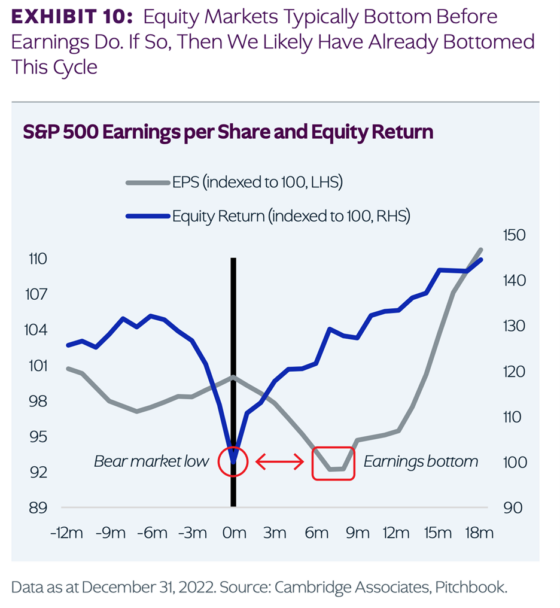
  • We think that the bottom is in for the S&P 500 this cycle, and that it occurred October 2022.

  • Similarly, within Credit, our view is that prices are likely to stabilize in the current $85-90 range, and while we expect an increase in defaults, we think the longer-term path is upwards from current levels.

  • Our proprietary framework suggests that cyclical leading indicators, on a net basis, are in a mild contractionary phase in the U.S.

  • Importantly, we do not expect the same type of economic downside as in past cycles, especially on a nominal basis.

After multiple trips across Asia, Europe, and the United States to pressure test our macro frameworks in the first-half of the year, we think investors are still too conservatively positioned for the path forward we are seeing for the global economy.

  • We actually remain constructive on risk assets, given stronger nominal GDP growth than in past cycles.

  • Rarely has there been such an intersection of poor near-term fundamentals, more than offset, we believe, by a compelling technical backdrop (i.e., little new issuance supply, record buybacks) and resounding negative sentiment (S&P 500 shorts are near 30-year highs); at the same time, recent dislocations have created some stand-out investment opportunities that traditional 60/40 investors might be overlooking.

We continue to believe in our ‘higher resting heart rate’ thesis as the crucial disinflationary forces of the last ten years (globalization, lower energy prices, and a labor surplus) have all largely reversed course.

  • Near term crosscurrents notwithstanding, we remain constructive on the structural outlook for energy and energy-related investments going forward. We think impressive capital discipline by U.S. producers could support durable long-term pricing that averages closer to $80 per barrel, up from the pre-pandemic range of $50-60 per barrel.

  • We still think that markets are not fully pricing the uncertainty around the pace of Fed cuts, which is why we still have 10-year Treasury yields ending the year at four percent.

  • Though we are more conservative on growth in the developed markets in coming years, we think the biggest surprise this cycle may be that growth does not slow as soon, or as disastrously, in aggregate as the consensus now expects.

  • One third of small banks’ assets are CRE loans. Deposit flight is also still an issue. As such, we think that more regional banks could come under pressure if we are right that the Fed does not cut rates in the near term.

  • We feel better that we will avoid a major drawdown this year.

  • We have now entered a new regime of higher nominal growth and structurally higher interest rates, which we believe suggests that investors cannot go back to what ‘worked’ over the last ten years.

  • The most important takeaway for investors right now may be that, on a global basis, consumers are actually in better shape than many appreciate amidst improving wage gains, elevated household savings, and meaningful fiscal tailwinds.

This is the new macro regime we believe investors must focus on when building portfolios.

Important: Not every company wins in this type of regime. Pricing power, competitive moats, margin stability, cash flow generators, and lower debt companies should be emphasized.

Compelling portfolio opportunities:

  • Given the ongoing banking crisis, most forms of both Liquid and Private Credit screen well in our forward expected returns analysis. Importantly, the recent turmoil in the U.S. banking system has only reinforced our view that corporations will need to seek alternative forms of lending to fuel growth, make acquisitions, and repay existing loans.

  • The last 5 years, Private Credit on average returns were ~6.5% net of fee/carry. Over the next 5 years, we expect this asset class to have estimated returns of ~8.3% net of fee/carry.

  • The last 5 years, Private Equity on average returns were ~15.6% net of fee/carry. Over the next 5 years, we expect this asset class to have estimated returns of ~11.9% net of fee/carry. This is versus an expected S&P 500 return of roughly 5.3% (9.4% last 5 years).

  • The last 5 years, the Global Agg Index on average returns were ~-1.7%%. Over the next 5 years, we expect this asset class to have estimated returns of ~4.4%.

  • We also think that today Cash is an interesting asset class.

  • Equities with growing dividends.

  • We reaffirm our call for stronger small-cap performance. U.S. small-cap stocks are trading at the biggest discount to large-cap stocks in over 20 years.

  • Foreign stocks are starting to look more interesting. We continue to see better value in Japanese, European, and even Mexican stocks, all of which are trading at relatively undemanding valuations and stand to benefit if we are right about a structurally weaker U.S. dollar.

  • Real assets look attractive in an era of higher inflation.

  • Given that U.S. real goods buying is still running six percent above trend, we continue to support flipping exposures towards services, which we now think could run ahead of trend for several years. Sectors such as tourism, health and beauty services, and entertainment still have a long way to go internationally, we believe.

  • We expect excess savings and a strong labor market to keep consumer spending above trend.

  • Asia is still in the process of post-COVID reopening, especially China, which often accounts for 20% or more of global growth. Against this backdrop, we continue to see an asynchronous cycle, with China’s reopening and recovery propelling regional growth higher. Connecting the dots: companies (brands) serving Asian consumers should perform well.

  • China consumers are still sitting on over six trillion RMB in ‘excess’ savings, equivalent to fully 15% of annual retail sales.

  • China Retail Sales are still 15% below its pre-COVID trend.

  • Spending on Generative AI looks set to explode in the coming years

Bottom line:

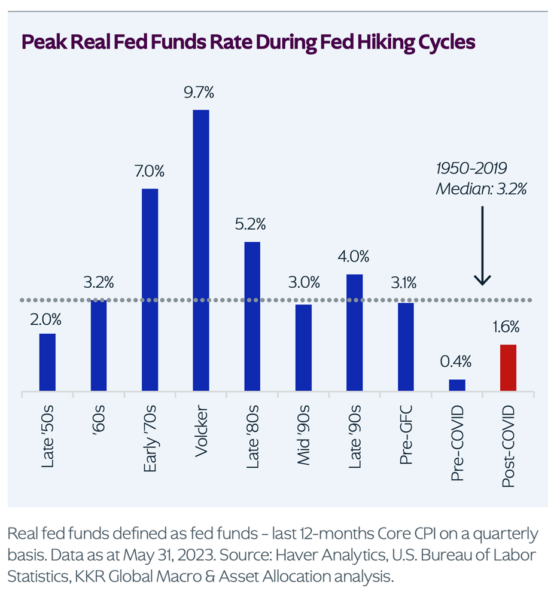
Unless the bull case unfolds, we expect a bumpy, volatile ride ahead, which would present investors with opportunities to lean into dislocations. Aka, build portfolios with the above themes in mind, hold some cash that earns 5% to be able to build bigger positions in these themes when dislocations occur. Our expectations for low but rising real rates point to more muted upside for multiples going forward. We are simply moving back to a more normal “base rate” and overall interest rate environment. That’s a healthy development but the road to normal could be bumpy on occasion. Use these periods to be an opportunist. Emphasis on ours.

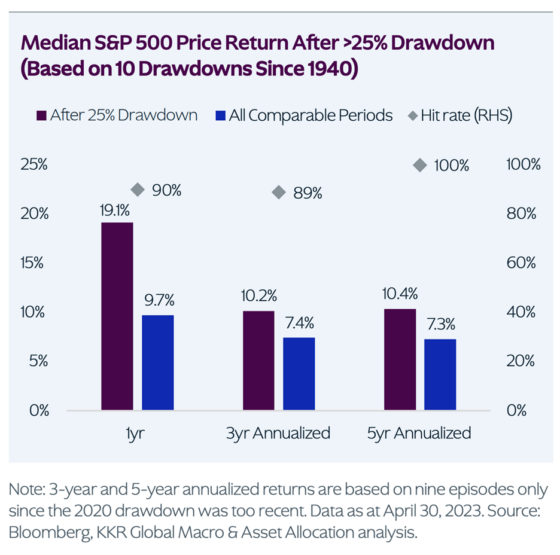
Historically, following large drawdowns, longer-term investors are generally rewarded over the next 3-5 years for leaning into dislocations.


Disclosure:
The above report is a hypothetical illustration of the benefits of using a 3-pronged approach to portfolio management. The data is for illustrative purposes only and hindsight is a key driver of the analysis. The illustration is simply meant to highlight the potential value of building a consumption focused core portfolio using leading companies (brands) as the proxy investment for the consumption theme. This information was produced by Accuvest and the opinions expressed are those of the author as of the date of writing and are subject to change. Any research is based on the author’s proprietary research and analysis of global markets and investing. The information and/or analysis presented have been compiled or arrived at from sources believed to be reliable, however the author does not make any representation as their accuracy or completeness and does not accept liability for any loss arising from the use hereof. Some internally generated information may be considered theoretical in nature and is subject to inherent limitations associated therein. There are no material changes to the conditions, objectives or investment strategies of the model portfolios for the period portrayed. Any sectors or allocations referenced may or may not be represented in portfolios managed by the author, and do not represent all of the securities purchased, sold or recommended for client accounts.  The reader should not assume that any investments in sectors and markets identified or described were or will be profitable. Investing entails risks, including possible loss of principal. The use of tools cannot guarantee performance. The charts depicted within this presentation are for illustrative purposes only and are not indicative of future performance. Past performance is no guarantee of future results.





In the Real World, We Love When Great Merchandise Goes on Sale. In the Investment World, Sales Can Offer Money-Making Opportunities.


Key Points

  • Over the long-term, Tech and Consumer Discretionary are two sectors to anchor to.

  • 2022 was a major “reset year” for stocks in general and tech & consumer in particular.

  • In 2023 – tech and consumer are winning again, but there’s still plenty of opportunities.

20 Years of Annualized Returns: Tech & Consumer Discretionary Outperform the S&P 500.

We know intuitively, buying great merchandise on sale is something consumers love. Ironically, in the investment business, when great stocks go on sale, investors tend to freeze or sell. That’s a mistake. Using short-term price direction as the mechanism to help make long-term investment decisions will often lead an investor astray. In this business, most funds, ETF’s or strategies tend to be anchored to a single or a few “style factors” or characteristics. Sometimes, the market favors strong top-line sales or high R&D spend, other times, the value factor is where returns are coming from. The important part of this story though: style factors go in and out of favor and the best opportunities come from understanding which factors, sectors, or thematics tend to work the best over longer periods of time. Once you understand this, 1) making sure you own the persistent winners is important and 2) being committed to adding to the LT winners when they experience the normal periods of underperformance offers a wonderful one-two punch to your long-term goal achievement plans. With that in mind, I thought I would investigate sector performance, short and long-term, to see if there’s any opportunities to seize.

20 years of data is a sufficient time frame, I think you would agree. For long-term investors, this is how the sector movie ends: Technology and Consumer Discretionary are the two key sector leaders over time. This shouldn’t be a surprise given these two sectors are key drivers of the global economy. Additionally, because of a recent sector shift by Index providers, a new sector, Communications Services has emerged. Many important tech & discretionary brands have been moved to the new Comm Services sector so I suspect this will also outperform over the long-term, particularly through names like: Meta (Facebook), Google, Netflix, Live Nation, and many more. Nothing happens every year but often, these two or three sectors and the high-quality brands that live here, should continue to perform well on an absolute and relative basis. Our research tells us most portfolios hold sufficient tech but not enough consumer exposure. Regardless, here’s the 20-year look across sectors.

Technology:

The tech sector performed very well versus all other sectors annualizing at ~14.1% over 20 years. This performance was generated by a handful of leading brands, however. Microsoft annualized at 16.5%, Apple at 38.2%, and Nvidia at 29.9% (source: YCharts). Important: the tech sector performed very poorly after the market peaked in March 2000. Some companies never recovered, but the leaders eventually began leading again. Those who understand buying great businesses on sale is smart and logical, got a chance to significantly beef-up their exposure to tech on mega-sale between 200-2003. When you know how the movie ends, you take advantage and buy more when the market acts irrationally.

Consumer Discretionary:

Not surprisingly, consumer stocks serving a strong consumer nation, also performed well annualizing at 10.5% over 20 years. A peek inside the index shows us again, a handful of great brands drove an even bigger portion of the gains in the sector. Stock selection really matters in consumer-land.

Amazon annualized at 23.4% over 20 years, Tractor Supply at 29.3%, Deckers Outdoors (owners of UGG and Hoka Shoes) at 31%, Booking Holdings at 26%, O’Reilly Automotive at 22.6%, and Dicks Sporting Goods at 17.1% per year.

My point is simple: When you know something has a history of performing well, 1) make sure you have an allocation to it for the long-term, and 2) when it experiences a period of underperformance, make sure you add to it while its down and so your speed to recovery is accelerated because of smart cost averaging strategies.

2022: The Great Re-set Year for Tech & Consumer Discretionary.

As you know, 2022 was a tough year for almost every asset class and style-factor. The growth and quality factors across equity-land performed particularly poorly. Why? Because interest rates went straight up for the entire year and multiples for growth stocks and sectors went down rapidly. That caused a ton of disruption across equities and fixed income. Ironically, business fundamentals were largely strong across the board, but the market did not care until late October. Many of the drawdowns in great businesses where irrational & illogical, and the opportunity created by buying more, was never in doubt. Over longer periods, the fundamentals always drive the bus. Here’s how 2022 looked at the sector level. Tech & Consumer Discretionary were the worst performers & Energy was the best performer. Great brands went on sale.

2023: A Mean Reversion via Tech & Consumer Discretionary Leadership.

Markets generally bottomed in mid-October last year and have largely trended higher into the recent month-end. You would never know it when you talk to investors, however. Massive amounts of money continue to go into money market funds, currently >$8 trillion. Only until recently and because of the AI FOMO, have investors decided to buy technology stocks. YTD, Technology and Consumer Discretionary are back on top and are the only sectors with positive returns thus far in 2023. Remember, many of the greatest brands live in the tech and consumer sectors so a brands-dedicated portfolio, by definition, will largely be anchored by tech and consumer stocks. Today’s market is incredibly bifurcated, though. The bulk of returns are coming from just a handful of great brands. As we started this year, the consensus thinking was for a continuing weak market into mid-year followed by a strong recovery. To date, the exact opposite is what has occurred. Consensus got it wrong again.

SUMMARY:

  • Over most periods since index creation in late 1989, tech and consumer discretionary stocks have tended to be outperformers.

  • Now you know how the movie ends. Now you know the answers to the test in advance.

  • When these important sectors go on sale, investors should begin adding more exposure.

  • Adding exposure to great brands and sectors on sale while they are experiencing temporary underperformance has historically been a very smart decision. Even after the current recovery, there are some very important, very dominant brands on sale.

Stay anchored to these two sectors for the long-term.

It’s not too late to pounce.

Buy/add on dips.

BRANDS MATTER

Disclosure:
The above report is a hypothetical illustration of the benefits of using a 3-pronged approach to portfolio management. The data is for illustrative purposes only and hindsight is a key driver of the analysis. The illustration is simply meant to highlight the potential value of building a consumption focused core portfolio using leading companies (brands) as the proxy investment for the consumption theme. This information was produced by Accuvest and the opinions expressed are those of the author as of the date of writing and are subject to change. Any research is based on the author’s proprietary research and analysis of global markets and investing. The information and/or analysis presented have been compiled or arrived at from sources believed to be reliable, however the author does not make any representation as their accuracy or completeness and does not accept liability for any loss arising from the use hereof. Some internally generated information may be considered theoretical in nature and is subject to inherent limitations associated therein. There are no material changes to the conditions, objectives or investment strategies of the model portfolios for the period portrayed. Any sectors or allocations referenced may or may not be represented in portfolios managed by the author, and do not represent all of the securities purchased, sold or recommended for client accounts.  The reader should not assume that any investments in sectors and markets identified or described were or will be profitable. Investing entails risks, including possible loss of principal. The use of tools cannot guarantee performance. The charts depicted within this presentation are for illustrative purposes only and are not indicative of future performance. Past performance is no guarantee of future results.
Consumer Spending on “Selective Indulgences” Remains Strong

Key Points

  • Spending is in our DNA. Currently, our actions towards “safety” tell a story.

  • Consumers are making choices because they have been over-paying for everything.

  • Selective Indulgence is a key part of consumer spending; some brands are winning big.

Spending is in Our DNA

In last week’s blog, I noted Retail Sales recently hit a new record of $7 trillion over the trailing 12 months. Aggregate spending is a bit above the long-term trend, so we expect the spending dynamic to change as consumers continue to make important choices. As personal income goes positive as inflation cools over time, positive spending and saving dynamics will emerge. For now, consumers are a bit nervous about the current economy, the political uncertainty, and the potential for an economic slowdown. They are being bombarded with negative news stories which keeps them from wanting to take risks in places like the stock market. To highlight this, the chart below shows where consumers are putting their money so far this year.

Money market funds yielding ~4-5% hold about $7 trillion of our money today, which earns much more than our checking accounts.  When consumers are nervous, holding more cash is always the first impulse and it makes us feel better. What I fear, they will stay in “safety” much longer than they should, which ultimately hurts their ability to generate the returns required to meet their long-term retirement goals. The best times to put our cash to work are the times when it feels the least attractive. That will never change. With markets performing much better than expectations, we suspect high net worth investors could begin to feel like they made a poor choice de-risking equities in Q4 last year. If the equity markets stay elevated, a FOMO effect could begin to build from those under-invested. FOMO happens when we are faced with falling behind in returns and feel compelled to chase equities, typically at the wrong time. The stats below show consumers have voted for safety for now. Equity outflows, safety asset inflows, and massive flows to money market funds is what has happened YTD. That tells me a lot as a contrarian investor.

Consumers Continue to Make Choices on Their Spending

Back to retail sales and the trends we see currently. We know with certainty that spending is in our collective DNA as a society. We are now beginning to see signs that consumers are not spending broadly but making important choices with their limited dollars. That will have implications for many businesses across a multitude of industries over the next 2 quarters. Last week, we talked about the mean reversion in spending and the parts of the goods economy that were still getting attention from a wallet-share perspective. The moral of the story: the spending was heavily skewed towards “needs versus discretionary wants.”


Selective Indulgence is a Key Focus for Those Willing to Spend Discretionary Dollars

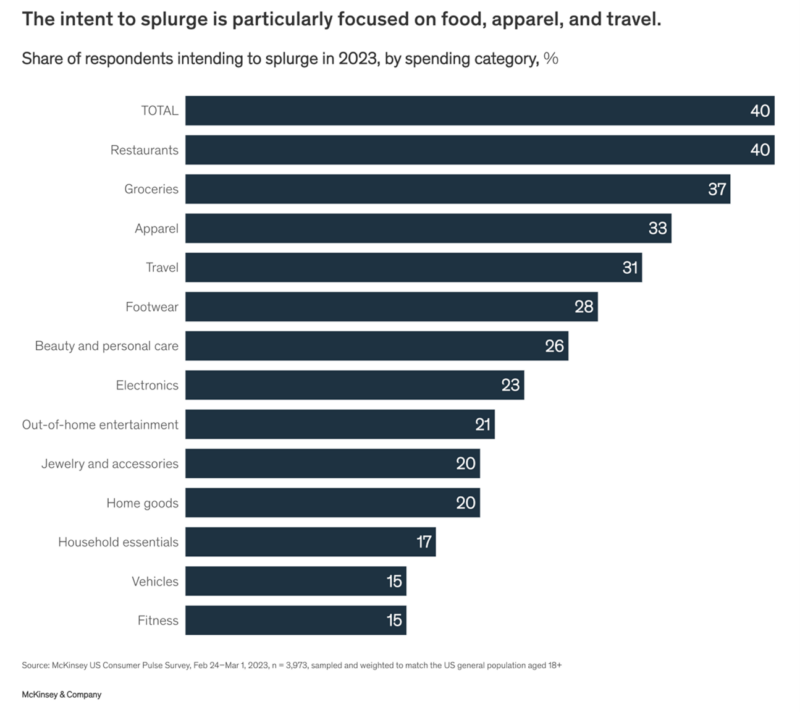
Research firm McKinsey recently released an intriguing report discussing the state of the consumer entitled, “Overall consumer spending growth is slowing, but consumers still intend to splurge on select categories.” The authors cite the concept of selective indulgence as the key focus for spending. Our work also suggests things like travel, recreation, eating out, and live events are preferred areas of attention. Generally, younger consumers and higher-income consumers seem to be the most positive, with the middle consumer a bit more cautious. Thus far from an earnings perspective, there’s strong evidence of strength across travel and lodging brands as well as recreation categories and the ancillary goods and services that benefit from our recreation activities. That should remain resilient as we enter the summer vacation season.

It’s quite clear from earnings across the whole group of consumption categories, there’s trade-down activity happening broadly. Our take: consumers are saving money in some places so they can splurge in other places. That behavior does not scream we have a “super-bullish consumer” but it also doesn’t scream a, “super-bearish consumer.” That’s why our current portfolio is currently balanced by discretionary spending beneficiaries and needs-based spending beneficiaries. The recent BofA & J.P. Morgan consumer spending reports also confirmed consumers are making choices and they are balanced by needs and wants.

From an “intent to splurge” perspective, the chart below shows the spending categories most cited in the McKinsey report. Roughly 40% of respondents cited the intent to splurge in 2023. Their focus is cited below. Eating out and in, travel, recreation, out-of-home entertainment, and apparel and footwear were noted widely. What I found interesting though, was the intent to splurge on grocery being part of the results. Normally, grocery is a staple of life, so splurging is not generally associated with a staples of life. Again, I would call the results of the survey as encouraging but not wildly bullish for continued, above-trend spending.

What Looks Most Attractive in the Selective Indulgence Thematic?

Out of home entertainment:

One key area of focus is events and concerts. Live Nation is the dominant live events brand around the world. In their recent quarterly report, they cite, “for the first time in three years, all of our markets are fully open. Over 19 million fans attended our shows across 45 countries, and we sold over 145 million tickets with record levels of activity across all markets.” Simply put, the pent-up demand for live events and concerts is a key source for revenge spending around the world. LYV also cited “global demand for live events is unprecedented. Revenue was up 73% to $3.1 billion. We have sold 90+ million tickets YTD and demand shows no signs of easing thus far.” The stock has had a robust recovery off the lows but is still well-off all-time highs and arguably they have better pricing power, higher demand, and stronger sponsorship opportunities as brands all over the world begin allocating more to this business segment after being absent for 3 years. The ancillary goods and services around live events and travel should also perform well. Those include beer, wine and spirits, apparel merchandise, and overall food and beverages like Coke, Pepsi, and energy drinks.

Travel:

We are just beginning the summer travel season and virtually every part of the travel infrastructure is screaming the same thing: we are going on vacation and travelling to places like Vegas in droves. As our savings have been drawn down, we have been saving money over the last few months so we can spend more on our vacations. We will eat out, buy beauty products, buy snacks and beverages and likely shop for apparel & footwear while on vacation. The travel platforms like Booking, Expedia, Airbnb, and hotels like Marriot, Hyatt, and Hilton have all reported strong bookings while seeing consumers more interested in price discounts. Even airlines, some of the worst businesses in the world to run and invest in, are seeing record demand with lower airline fuel prices. For now, the “selective indulgence” trade is alive and well.


Disclosure:
This information was produced by Accuvest and the opinions expressed are those of the author as of the date of writing and are subject to change. Any research is based on the author’s proprietary research and analysis of global markets and investing. The information and/or analysis presented have been compiled or arrived at from sources believed to be reliable, however the author does not make any representation as their accuracy or completeness and does not accept liability for any loss arising from the use hereof. Some internally generated information may be considered theoretical in nature and is subject to inherent limitations associated therein. There are no material changes to the conditions, objectives or investment strategies of the model portfolios for the period portrayed. Any sectors or allocations referenced may or may not be represented in portfolios managed by the author, and do not represent all of the securities purchased, sold or recommended for client accounts.  The reader should not assume that any investments in sectors and markets identified or described were or will be profitable. Investing entails risks, including possible loss of principal. The use of tools cannot guarantee performance. The charts depicted within this presentation are for illustrative purposes only and are not indicative of future performance. Past performance is no guarantee of future results.
Consumer Spending is Mean Reverting Back to Long-Term Trend

Key Points

  • U.S. Retail Sales has mean reverted to its long-term trend (as expected).

  • Because of high inflation and macro uncertainty, consumers are forced to make choices again.

  • Spending on “essentials” and “must-have” discretionary items is the focus for now.

Consumer Spending Has Been Robust and Has Mean Reverted Back to Trend

When consumers were locked in their homes and shopping online, savings rates and goods spending went parabolic. When things go parabolic, they should be expected to mean revert to the long-term trend over time. That’s exactly what has happened with Retail Sales and the components within this $7 trillion per year component of GDP. The entire COVID period is now normalizing from a spending perspective, but there will still be some ripples across different categories. Consumers over-spent on goods and durable items and under-spent on services and experiences. We see some fracturing of services spend around the edges currently, but this component of spending is still more stable and elevated relative to the goods spending that is soft as we enter summer vacation season.

As you can see from the chart below, retail sales went parabolic and have now steadily fallen back to an area where it tends to chop around. We are watching closely for continued weak spending, which could warrant more defensiveness in our positioning. With inflation across most services and food categories, we expect consumers to simply make choices about where to spend their money and time. Some items will be deferred while others get the benefit of our marginal discretionary dollar. Needs over wants is our focus, while also holding exposure to the most important wants, which include technology, travel, everyday fashion apparel & footwear, and entertainment.

Consumers Do Not Have Unlimited Spending Capacity; Choices Must Be Made

The bears will highlight the extreme fall of total credit and debit card spend, but one must remember the spending was extreme and always expected to mean revert down. Whether consumers retrench even more aggressively, only time will tell, but thus far we are seeing exactly what we expected in spending trends. This BofA spending chart from their May 2023 report highlights what’s been happening since the peak in Q1 2021. Remember, our savings ballooned and have also mean reverted to slightly below long-term averages, now about 4.6%. Savings are now being built up again as we get more nervous about the economy. BofA states, savings overall are still about 40% higher on average than the 2019 levels, so there is still a savings cushion for most consumers. Lots of data here for a bear or a bull which simply makes for more volatility around these numbers.

Digging deeper into consumer spending, the chart below highlights how consumers are making choices and where they are spending today. To reiterate, for now, it’s a “needs over wants” spending environment. The chart shows U.S. Retail Sales by component on a year-over-year basis. The focus continues to be experiences and “needs spending” across these areas: general merchandise (includes grocery), health & personal care, food & beverages, eating and drinking out, and nonstore retailers (e-commerce) over physical shopping. Traffic trends to physical stores has been slowing. With belts tighter from inflation, perhaps families are spending less in April, May, and maybe even half of June so they can have more fun and spend on vacation? Our family is certainly thinking that way.

As we look at stock performance, it’s clear for now, the defensive stocks are holding up well while many retailers and specialty retailers have pulled back. Based on our work, we could see one more quarter where retail sales trends get softer, which could offer much better entry points in some great retail stocks and even a few secondary brands that have gotten overly beaten up.

What Looks Attractive Now Across Positive Trending Categories?

General Merchandise:

Costco is still performing well, and the stock is off from the recent peak offering an opportunity. The management team at Costco are some of the best in the industry and as they see their costs fall from vendors, they pass along the savings to customers. That’s why the loyalty is so strong at Costco. They recently raised the dividend by 13%, which is better than most other consumer brands. Their business serves our general merchandise and grocery needs well so we expect stability in this great business model.

Health & Personal Care:

In last week’s blog, I highlighted a new edition to the portfolio in KenVue, the largest consumer healthcare brand by sales in the world. They own our medicine cabinet with brands like Band-Aid, Benadryl, Listerine, Pepcid, and Zyrtec for your seasonal allergies. If you haven’t read the report, click here to read it.

Food & Beverage:

Some of these brands have been monster performers for a long period of time and with consumers making choices and favoring needs, we still like these brands. Snacks are very important to consumers and Pepsi, through their house of brands that include Lay’s, Doritos, Ruffles, Tostitos, Sunchips, and Cheetos are doing quick well. In the most recent quarter, management cited strong volume trends with good pricing power and no pushbacks on price thus far. Hershey is performing well also and should benefit from falling input costs while prices remain higher. The stock is not cheap, but we see strong trends across this wonderful portfolio of brands. The traditional beverage business with Pepsi, Gatorade, Aquafina Water, 7Up, Starbucks Beverages, and its newest addition with the stake in emerging energy brand Celsius continue to do well. Similarly, Coke and its top beverage brands that include its partnership with Monster Beverage are performing well.

Food & Drinking Services:

Leading Brands like Starbucks, McDonald’s, Chipotle, Domino’s, and restaurants and bars are still performing well. So many of these brands, particularly local restaurants, have taken prices up significantly as workers were hard to find and expensive. I keep waiting for consumers to push back on price here but thus far, the top brands and our favorite restaurants are still performing well. Margin pressure could be a problem soon if consumers finally push back on their spending in this category.

E-Commerce:

Amazon is the 800 lb. gorilla in this category and we still think this stock has much further to run. It’s basically gone nowhere for a few years, yet revenues have ballooned. As their spending mean reverts closer to long-term averages, we expect the free cash flow line to vault higher once again. The stock is not currently priced for this eventuality in our opinion.

 Next week, I’ll tackle the spending in services and which categories across travel and recreation still look attractive.


Disclosure:
This information was produced by Accuvest and the opinions expressed are those of the author as of the date of writing and are subject to change. Any research is based on the author’s proprietary research and analysis of global markets and investing. The information and/or analysis presented have been compiled or arrived at from sources believed to be reliable, however the author does not make any representation as their accuracy or completeness and does not accept liability for any loss arising from the use hereof. Some internally generated information may be considered theoretical in nature and is subject to inherent limitations associated therein. There are no material changes to the conditions, objectives or investment strategies of the model portfolios for the period portrayed. Any sectors or allocations referenced may or may not be represented in portfolios managed by the author, and do not represent all of the securities purchased, sold or recommended for client accounts.  The reader should not assume that any investments in sectors and markets identified or described were or will be profitable. Investing entails risks, including possible loss of principal. The use of tools cannot guarantee performance. The charts depicted within this presentation are for illustrative purposes only and are not indicative of future performance. Past performance is no guarantee of future results.

Rotate in May and Go Play!

Key Points

  • Sell in May and go away is the market narrative but it’s track record is spotty.

  • Getting more defensive with leading healthcare & staples brands seems to work better.

  • As the economy cools further, this strategy seems to have strong merit today.

Sell in May, Go Away?

As April ends and May begins, the drumbeat of “Sell in May and Go Away” grows louder and louder. It’s important to remember two things about this concept: 1) it does not work every year and 2) a better approach has typically been to “rotate to defensives” like healthcare and staples in May versus going away entirely. Every year is unique and there’s always earnings, macro, Fed policy, and geopolitics driving the narrative so making a 1-size fits all decision is likely to end with mixed results. This year, and much to the chagrin of bears, tech and consumer discretionary sectors have performed much better than expected. That tends to happen when bearish sentiment and positioning gets as extreme as it was in Q4 last year. Much of that bearish positioning has been rectified today and healthcare and staples have lagged thus far in 2023. We think that’s about to change as money begins to rotate to get more balance as it seeks more stable, predictable earnings. Time will tell, we certainly do not know the future better than anyone else but in today’s note, I thought it would be interesting to look back at other difficult market years to see how a blend of 3 leading healthcare and staples brands performed versus the S&P 500 and Nasdaq 100 in the May – October period. Very interesting results for people that think the economy gets softer from here as the Fed’s actions begin to filter through the system.

Rotating to healthcare & staples, “defensives”, has a terrific track record in tough periods.

Rather than use broad-based ETF’s as the proxy for this theme, I created an equal-weight 6 stock model portfolio using 3 leading healthcare brands across managed care, pharma, and life sciences & tools (UNH, LLY, TMO) and 3 leading consumer staples brands across general merchandise shopping, fast casual restaurants, and packaged foods (COST, MCD, HSY). I then compared the indices to this defensive, healthcare/staples basket while using SPY and QQQ as the proxy for the broad market. Generally, in positive trending bull markets, the defensive blend lags which we would expect, but in more difficult years, the defense basket generally shielded investors from bigger downside action in the indices. Additional brands that tend to be quite resilient in turbulent times include: Church & Dwight (CHD), Procter & Gamble (PG), Mondelez (MDLZ), Coca-Cola (KO), Pepsi (PEP).

Economic weakness just ahead could favor the defense basket.

Equities have generally performed better than expected thus far in 2023. Earnings beats are slowing, and breadth has been quite poor for the last few weeks. The mega-cap brands have largely done all the heavy lifting where YTD performance is concerned. Either the laggards need to begin performing or the leaders could join the laggards and provide further market weakness.

Only in time will we know what happens but here’s how the indices have performed versus the healthcare and staples blend in years with a recession or some idiosyncratic macro issues that caused some market dislocations The defensive blend is in blue.

2000-2002 Internet Bubble & Recession: Defensives Win Big Through the Entire Period.

2000-2002 May-November, 3 Periods: Internet Bubble & Recession: Defensives Did Their Job.

2008: Great Financial Crisis. Defensives Lose Much Less.

2011: Debt Ceiling Crisis & European Debt Issues. Defensives Win.

2018: Strong Market Until Fed Hikes Rates Into an Economic Slowdown: Defensives Win Big.

2022 Peak Market, Historic Rate Hikes, & 40 Year High Inflation: Defensives Win Big.


BOttom Line:

The market has performed fairly well YTD but we see some softening in prices as earnings & margins become the focus. Generally, defensive business models offer more stable & predictable earnings and dividends, which makes them very interesting in slowdowns. Additionally, capital tends to rotate to defensive sectors and businesses when volatility and uncertainty arises. Healthcare is a big laggard YTD after having a stellar 2022 and seems to be refreshed and ready to begin performing again. Using the ETF’s for healthcare and consumer staples seems fine but my work shows betting on a handful of leaders tends to enhance the experience. In former years where markets were volatile with a downward bias, the defensive basket of leading brands tended to either deliver a positive return or offered much less downside than the indices and other beta sectors.


Disclosure:
This information was produced by Accuvest and the opinions expressed are those of the author as of the date of writing and are subject to change. Any research is based on the author’s proprietary research and analysis of global markets and investing. The information and/or analysis presented have been compiled or arrived at from sources believed to be reliable, however the author does not make any representation as their accuracy or completeness and does not accept liability for any loss arising from the use hereof. Some internally generated information may be considered theoretical in nature and is subject to inherent limitations associated therein. There are no material changes to the conditions, objectives or investment strategies of the model portfolios for the period portrayed. Any sectors or allocations referenced may or may not be represented in portfolios managed by the author, and do not represent all of the securities purchased, sold or recommended for client accounts.  The reader should not assume that any investments in sectors and markets identified or described were or will be profitable. Investing entails risks, including possible loss of principal. The use of tools cannot guarantee performance. The charts depicted within this presentation are for illustrative purposes only and are not indicative of future performance. Past performance is no guarantee of future results.

How to Play Offense & Defense in a Portfolio: Part 2 – Offense

Key Points

  • A balanced portfolio holding companies that play offense & defense is key.

  • In the new economic regime, certain style factors make the most sense.

  • Top “offense-oriented” brands grow despite short-term economic slowing.

Balance in a portfolio can help offer a smoother ride to investors.

For Part 2 of the portfolio creation topic, I wanted to shift to offense. There’s thoughtful, steady growth while paying attention to costs and maintaining high operational efficiency and there’s growth at all-cost. When rates were at zero and access to capital was plentiful, the “growth-at-all-cost” companies performed exceptionally well. In today’s new regime of higher base rates cost of capital, and inflation, those companies are not where one should be focused, in our opinion. This week let’s focus on the “grow through a slowdown while running the business prudently” group of offense-minded brands.

As the Fed’s aggressive actions begin to take effect across markets and the economy, it’s important to remember that brands highly focused on offense tend to be growth-oriented businesses which also tend to be higher beta (more volatile than defensives generally) and could struggle in a slowdown as end-markets slow and revenue growth eases a bit. Secular growth, or mega-trends as we call them, tend to be more stable and long-lived and can sometimes be less sensitive to shorter-term slowdowns than other cyclical growth opportunities.

Remember, to oversimplify, this is generally what investors want when they make the decision to invest their capital for long-term growth. Knowing these end-goals helps build the most appropriate portfolio for investors:

  1. Achieve attractive returns

  2. Have as smooth a ride along the way as possible.

  3. Reach their target goal on time and intact.

How they accomplish these three goals is where the magic happens. In many cases, it’s BALANCE that helps them experience a smooth ride. When the economy slows, the best companies and brands make important decisions about where to cut costs while also continuing to grow and take market share. In fact, the best brands tend to take market share in difficult periods because they think long-term, and they have strong balance sheets that enable them to spend through slowdowns.

Important style factors for the new investment regime.

Reminder: style factors describe the characteristics of a business. Most of the time, we tend to be overweight the “quality” style factor partly because it tends to outperform long-term and partly because top brands tend to be high quality companies relative to the stock universe.

From an offense and “prudent growth” perspective, there are a handful of metrics that we believe are important to focus on today. If you are a business owner, you will instantly appreciate the importance of these metrics: high free cash flow, high free cash flow growth, high return on invested capital (ROIC), fairly stable revenue growth over time, a steady reduction in the number of shares outstanding if possible, strong balance sheet, better margins than industry peers, reasonable valuations relative to the growth opportunities in front of them, high interest expense coverage so you can service debt easily, margin expansion possibilities, and positive EPS and revenue revisions. If you want to know why market returns tend to come from only a handful of companies, look no further than the rigid list of strong metrics I have listed above. Should anyone be surprised that the bulk of long-term market returns come from a much smaller number of companies that have superior business models, management, and global opportunities?

Quality, Stable Offense via Growth Brands

Generally, the companies that can continue to grow their revenue and free cash flow across multiple demographic groups, geographies, economic environments, and through new product innovations, tend to generate strong investment returns for shareholders. These are also the brands that tend to join the $trillion-dollar-club over time. Sometimes, these companies are called “compounders”, we call them Mega-Brands. Using real-time corporate data, here’s a few Mega Brands that seem well-positioned today, rank highly across the factors cited above, and should show some stability in an economic slowdown:

Visa (V) & Mastercard (MA): “Everywhere You Want to Be”.

The use of cash has been slowly falling all over the world. In emerging market economies, the trend of using cash over cards is more prevalent still, given a large segment of the emerging consumer population does not have a traditional bank account. However, there are tons of fin-tech brands building unique value propositions to help these consumers enter the “swipe over cash” thematic. Yet, two mega brands still dominate the payment processing industry, and they are wonderfully profitable businesses. Collectively, Visa and Mastercard process almost 85% of payment transaction in the U.S., the world’s largest economy. As the economy slows and consumers make choices where and how to spend, having less exposure to consumer credit issues is ideal. Unlike American Express, CapitalOne and others, Visa & Mastercard have very little credit risk embedded in their businesses.

Consider them the owner and partners in a vast global toll-road where every visitor must pay the toll. Roughly 70% of every revenue dollar falls directly to the free-cash-flow line of Visa/Mastercard. They score in the 99 & 100th percentile for high margins and in the top decile for free cash flow metrics & operating efficiencies. They are aggressive buyers of their own stock when the stocks underperform, as they did through Covid when cross-border travel was virtually shut-down. Being more aggressive with new buying when stocks are low is exactly the kind of behavior that tends to reward companies and investors over the long-term.

Fun fact: V/MA stock has handily outperformed the S&P 500 Index over the last 1, 5, 10 years and since both went public. Over the last 3 years, with Covid restrictions and cross-border travel issues present, the stocks have underperformed. In our opinion, both companies are undervalued and will beat expectations over the next 12 months as global travel normalizes and higher average inflation keeps average transaction value elevated.

Tesla: TSLA

Achieving scale is the key to maximizing efficiencies. Tesla has a huge lead over peers, and we think it’s sustainable for many years to come. As automation and robotics drive productivity and manufacturing gains, Tesla will continue to grow much faster than most companies, regardless of industry. Yes, Tesla could be the most polarizing brand ever created and the stock is neither cheap nor stable from day to day. Additionally, if we enter a true recession, their growth could slow a bit but it will rip right back once consumers feel better about the economy.

Aside from the love or hate of Tesla, hiding in plain sight is a massive secular growth trend that is still in its infancy: the electrification of everything, starting with vehicles.

To be clear, the major opportunity for Tesla shareholders was going from small production to major production.

That stage for Tesla is largely complete but when you look at the small overall EV adoption curve and its growth trajectory while combining Tesla’s manufacturing lead and its strong brand as THE innovator in the space, there’s more growth for the company and stock in my opinion. I have little doubt that Tesla will once again be part of the $trillion club. The global opportunity is simply too large and attractive. Oddly, the stock is still under-owned institutionally, yet it has some of the most robust growth metrics relative to other companies who play offense. Here’s a quick glance at Tesla’s metrics at fiscal-end 2017 versus fiscal-end 2022:

  • $11.8B in annual revenue.

  • $3.4B in total cash.

  • Model 3 deliveries were just beginning.

  • There was no Model Y yet.

  • 1128 supercharging locations globally.

  • Automotive gross margins: 18.9%.

Here’s how fiscal 2022 ended for Tesla:

  • $81.4B in annual revenue.

  • $22.2B in cash with no debt – a monster achievement for any car company.

  • $7.56B in free cash flow generated.

  • Model 3 and Model Y scaled production has occurred.

  • ~4200 supercharging locations globally.

  • Automotive gross margins: 25.9% – the best in the industry.

Tesla stock can be a wild ride at times given how polarizing Elon Musk is and how noisy the earnings releases can be quarter-to-quarter but keep your eye on the prize: global EV adoption. Volatile stocks like this should be sized accordingly in a portfolio but TSLA surely added some value to a portfolio as they reached global scale.

A $10,000 investment in July 2010 would be worth $1.26 million today versus ~$51k in the S&P 500.

EV Sales are still small but growing rapidly.

Retail buying of used EV’s will grow even faster and Tesla has the most to gain as trailblazer!


Disclosure:
This information was produced by Accuvest and the opinions expressed are those of the author as of the date of writing and are subject to change. Any research is based on the author’s proprietary research and analysis of global markets and investing. The information and/or analysis presented have been compiled or arrived at from sources believed to be reliable, however the author does not make any representation as their accuracy or completeness and does not accept liability for any loss arising from the use hereof. Some internally generated information may be considered theoretical in nature and is subject to inherent limitations associated therein. There are no material changes to the conditions, objectives or investment strategies of the model portfolios for the period portrayed. Any sectors or allocations referenced may or may not be represented in portfolios managed by the author, and do not represent all of the securities purchased, sold or recommended for client accounts.  The reader should not assume that any investments in sectors and markets identified or described were or will be profitable. Investing entails risks, including possible loss of principal. The use of tools cannot guarantee performance. The charts depicted within this presentation are for illustrative purposes only and are not indicative of future performance. Past performance is no guarantee of future results.

How to Play Offense & Defense in a Portfolio: Part 1 – Defense

Key Points

  • A balanced portfolio holding companies that play offense & defense is key.

  • In the new economic regime, certain style factors make the most sense.

  • Certain “defense-oriented” brands are performing quite well today.

Balance in a portfolio can help smooth the bumps to offer a smoother ride.

I wanted to do a two-part series, one focused on the benefits of holding defensive business models that tend to perform well in more difficult economic periods, and one focused on playing offense through secular growth brands. 2022 was an odd year, the highest quality secular growth companies generally delivered solid fundamental business performance, yet their stocks generally got absolutely annihilated. Generally, it was the contraction of the multiple, or what investors were willing to pay for high quality, that the market clearly questioned. Ironically, many of last year’s best performers turned in average operating performance but money flowed to these stocks because they were “defensive business models”. The growth of passive investing and ETF’s has driven this basket of stocks mentality whether there is any logic or not. In the end, what makes an asset price go up is simply having more buyers than sellers.

At the highest level, I think investors have three main goals from the investing they do:

  1. Achieve attractive returns.

  2. Have as smooth a ride along the way as possible.

  3. Reach their target goal on time and intact.

How they accomplish these three goals is where the magic happens. In many cases, it’s BALANCE that helps them smooth the ride. To get some balance, defensive business models and the stocks of these companies are where investors can turn.

Important style factors for the new investment regime.

Style factors describe the characteristics of a business. Defense or offense. High quality or lower quality, highly levered or low leverage. Large versus small. Domestic sales versus international sales. Our team tracks a few dozen style factors so we can see where the returns are coming from in the market. Think of this like a pond for fishing. When the fish are only gathering in one part of the lake, the fishermen should gather there too. Our portfolios generally hold a portion of the companies with a high weight toward style factors that are working as well as having some exposure to companies that are out of favor but likely to see some resurgence in time. That way we always have some balance to the portfolio and there’s always a new emerging winner to consider. Overall, we tend to always be overweight the “quality” style factor partly because it tends to outperform long-term and partly because top brands tend to be high quality companies.

Year-to-date, the quality factor has gotten back to performing well after having a difficult 2022. Within the quality factor, these are some of the sub-factors that are working again: high free cash flow, high free cash flow growth, pricing power, strong balance sheets, revenue growth, better margins than industry peers, dividend growth and margin expansion. I have written many times; the big opportunity is to add to outperforming style factors when they go through shorter periods of underperformance. It may feel bad when you add but when you know how the movie ends, you’re never afraid.

Defense

Alabama coach Bear Bryant used to say, “defense wins championships.” The truth is, having a solid defense AND offense tends to win championships but in markets, defense tends to win in tough, uncertain economic environments because companies that have more defensive business models tend not to suffer big erosions in revenues and earnings. Their stocks tend to underperform in up markets and outperform in down or sideways markets but sometimes there are special companies that win more of the time. Having some exposure to both types of companies seems to make a ton of sense today. With that in mind, I wanted to discuss a few gems that seem to be all-weather brands while still having strong defense-oriented characteristics:

Hersey: HSY

Consumers all over the world love their snacks and chocolates. Hershey has been a monster in the industry and a stellar investment over many decades. The company is one of those special blends of stable, predictable grower and a key defensive for more turbulent economic periods. When you are happy, you snack. When you are sad, you snack more! Hershey management has been making very strong acquisition decisions in the snacking category and they are not done. Consumers love their products and have voted with their wallets. The brand has strong pricing power, understands how to integrate an acquisition and drive higher volume growth. From a style factor perspective, HSY scores incredibly well in key defensive areas: dividend growth, higher margins than peers, attractive dividend, strong FCF growth, size, low volatility (beta), high return on invested capital when compared to the weighted cost of capital (WACC), and very stable, predictable earnings trends. The perfect stock for this environment in our eyes.

Fun fact: HSY stock has handily outperformed the Consumer Staples sector, the top performing broad equity style, growth, and the Nasdaq 100 over the last 1, 3, 5, 10, 15, and 20 years. Something as simple as snacks and chocolates can add a lot of value to a portfolio.

Costco: Cost

First, I’ll admit something: I do not like the shopping experience at Costco. And yes, I’ve been a member for many years and yes, we visit Costco every week. That’s how powerful this model is. With the best management team in retail, Costco has been serving consumers globally for many decades. Imagine a business model where consumers pay the brand for the right to have access to the stores and its merchandise. Member renewal rates are about 90% and we all get great values when shopping at Costco. Yes, this great brand was a big Covid beneficiary but once you jump onto the hamster wheel, it’s hard to jump off. Their private label brand, Kirkland is a monster and would be the dominant category killer in most sub-categories if it were an outside brand. It’s estimated to have an annual revenue run rate of about $75 billion. Costco runs on slim margins and high volume so when you have significant private label success, you can expand margins without affecting consumer price points. There’s so much more store growth possible outside North America as well.

From a quality and defensive business model perspective, Costco scores quite well. High sales, strong economic moat, high free cash flow, top quartile dividend growth, still cheap on a price to sales basis, low debt, strong balance sheet, incredibly predictable earnings, very low default probability, and a significant amount of cash on the balance sheet.

Like Hershey: COST stock has handily outperformed the Consumer Staples sector as well as the top performing broad equity style, growth, and the Nasdaq 100 over the last 1, 3, 5, 10, 15, and 20 years.

My question to every reader: what percent of your portfolio holds stable, predictable brands that can play offense and defense while delighting you on a regular basis? I urge you to look around your house and identify which brands you will turn to in good times and bad. If the masses also feel that way, there’s a good chance they have been stellar investments too.


Disclosure:
This information was produced by Accuvest and the opinions expressed are those of the author as of the date of writing and are subject to change. Any research is based on the author’s proprietary research and analysis of global markets and investing. The information and/or analysis presented have been compiled or arrived at from sources believed to be reliable, however the author does not make any representation as their accuracy or completeness and does not accept liability for any loss arising from the use hereof. Some internally generated information may be considered theoretical in nature and is subject to inherent limitations associated therein. There are no material changes to the conditions, objectives or investment strategies of the model portfolios for the period portrayed. Any sectors or allocations referenced may or may not be represented in portfolios managed by the author, and do not represent all of the securities purchased, sold or recommended for client accounts.  The reader should not assume that any investments in sectors and markets identified or described were or will be profitable. Investing entails risks, including possible loss of principal. The use of tools cannot guarantee performance. The charts depicted within this presentation are for illustrative purposes only and are not indicative of future performance. Past performance is no guarantee of future results.

Quality + Brands + Private Market Opportunities

Key Points

  • The Brands Fund, while being volatile at times with wild markets, continues to have a comfortable lead on the S&P 500 YTD. The quality factor, has come back en vogue. Please make sure you have sufficient exposure to this style factor. It's likely one of the most important factors to lean on during periods of uncertainty.

Market comments

There's a ton of uncertainty these days and short-term we could see an acceleration of this uncertainty. That likely means clients are experiencing an elevated amount of angst. That puts pressure on them, on you, and ultimately on their interest in sticking to your long-term plan. It's in these times that an investor can make knee-jerk decisions that get them off course. Holding a lot more cash or perceived safety assets is a decision that always feels good at the time, I respect that. The problem tends to be getting back in. The best times to dive back in the pool (low prices) are always during periods when most people want to be as far away from the pool as possible. Most investors lead with their emotions and emotions rarely lead them to make solid investment decisions. That's where experience and a willingness to be greedy when others are fearful can really add value to a client relationship. Blackstone, KKR, Brookfield and others are the best at buying fear and panic and these three alone have over $380B of dry powder available currently. These are savvy, patient investors. Private lending, in particular, has a very robust opportunity today, as banks retrench and private markets become price makers and offer the bespoke solutions that companies need. When you are a price maker, the terms and protective covenants are highly in your favor. Their expertise is working for us in the fund.

The Set-up:

For a variety of reasons, a higher resting heart rate for inflation, fed funds, rates, and the cost of capital should be the expectation for the foreseeable future. Not every asset class or company will thrive in this environment and it could be a wild ride at times given such a long period of zero rates and free money. Zombie companies keep floating to the surface right now. Thankfully, there are a handful of timeless investment thematics (global consumer is one) as well as many "alternative" investment options available to investors. Everyone needs some exposure to the most opportunistic asset managers in the industry yet few actually have it and they are not readily available in ETF's. You get that exposure in the brands fund. Most HNW investors are incredibly overweight the liquidity factor yet it causes angst, often pushes people off course, and is the opposite of how the smartest endowments manage assets.

Investors simply want this: Adding an allocation to Alts can be a solution.

1.  Attractive returns over time.

2.  As smooth a ride as possible along the journey.

3.  To reach their goals, on time, and in-tact.

Fun Facts: See the image below for asset class returns 2007 - Q3 2022

1.  Institutions like Endowments tend to perform much better than HNW investors.

2.  These Endowments tend to have about 30-50% of their assets in Private assets.

3.  Privates, on average handily outperform public comps with much less VOL.

4.  The average HNW investor portfolio annualized return over 15 years is ~6-8%.

5. Top Endowment portfolios like Princeton, Harvard, Michigan, have average annual return is ~12-13%. Princeton's annualized return since 1977 has been +13%, they hold a very high weight to "alts" at ~70%.

Building a portfolio of solid, timeless thematics PLUS a handful of private alternatives can really add value to a portfolio and offer a smoother ride along the way. The new regime stated above is the catalyst for these potential portfolio changes. In equities: pricing power, solid balance sheets, big market share, high FCF, and margin stability are key. Yes, I've just defined an iconic, highly relevant global brand. Keep your eye on the prize, great brands make great investments and the savvy investor uses periods of turmoil to accumulate more great brands.

bottom line

Investors are scared, confused, and likely questioning their investments during this normalization process. Re-connecting with them and taking their emotional temperature is likely a very good idea. In order to help you accomplish this, we created a quick 30 question Q&A template to help identify what they really want & need these days. It's a great model you can use as a starting point for spot-checking your portfolio models for proper suitability.


Disclosure:
This information was produced by Accuvest and the opinions expressed are those of the author as of the date of writing and are subject to change. Any research is based on the author’s proprietary research and analysis of global markets and investing. The information and/or analysis presented have been compiled or arrived at from sources believed to be reliable, however the author does not make any representation as their accuracy or completeness and does not accept liability for any loss arising from the use hereof. Some internally generated information may be considered theoretical in nature and is subject to inherent limitations associated therein. There are no material changes to the conditions, objectives or investment strategies of the model portfolios for the period portrayed. Any sectors or allocations referenced may or may not be represented in portfolios managed by the author, and do not represent all of the securities purchased, sold or recommended for client accounts.  The reader should not assume that any investments in sectors and markets identified or described were or will be profitable. Investing entails risks, including possible loss of principal. The use of tools cannot guarantee performance. The charts depicted within this presentation are for illustrative purposes only and are not indicative of future performance. Past performance is no guarantee of future results.
How Advisors Can Act in Their Clients’ Best Interests When It Matters Most

Key Points

  • Advisors have a fiduciary responsibility to act in their clients’ best interests.

  • Knowing your customer and being laser-focused on investment suitability is vital.

  • The discovery process between advisors and clients & potential clients needs a facelift.

Investors are more confused than ever

Over the last 3 years, we have experienced a global pandemic, 2 equity bear markets, wild volatility across all asset classes, a historic tightening cycle led by the Federal Reserve, the highest inflation in 40 years, a de-anchoring from zero interest-rate policy, interest rate spasms, the worst returns for a 60/40 portfolio in our investment careers, and a brand-new banking crisis. Investors and advisors have a lot on their plates these days and keeping clients engaged while helping them protect themselves and sleep at night is as difficult as it’s ever been. I thought I would spend a little time this week highlighting some important ideas that can help streamline the process of keeping happier clients and helping them reach their goals in difficult markets. In order to accomplish this, getting back to basics might be in order. It’s time to revisit our clients goals, objectives, and needs and also to help protect ourselves as fiduciaries.

Know your customer & be laser focused on proper suitability

FINRA Rule 2090: Know Your Client Rule (KYC). It requires advisors to know the “essential facts concerning every customer and concerning the authority of each person acting on behalf of such customer” when opening and maintaining a client investment account. Unfortunately for advisors, the process of discovery is a fragmented one and things often fall through the cracks. Every firm has their own forms and processes, and every advisor tends to have their own approach to getting to know a client or prospective client. Sometimes it’s a yellow note pad and a face-to-face conversation(s) and other times the process gets more automated using technology and an online questionnaire. Regardless of the process, the data ultimately needs to get stored & updated periodically. That’s where the potential problems or deficiencies often begin. Fortunately, with the advent of sophisticated CRM platforms, the client information is now able to be accessed and altered as circumstances change.

FINRA Rule 2111: Suitability

Every year, there are thousands of customer complaints filed with FINRA citing poor recommendations that led to bad outcomes driven by problems with suitability. In its simplest form, advisors determine the suitability of an investment via matching proper investments based on a customer’s real-time investment profile. I say “real-time” because the goals, objectives, risk tolerances, time horizons, and return expectations change as a customer ages. If the customer profile doesn’t get updated as their needs and preferences change, the recommended investments may deviate from the original purpose creating a “suitability” mismatch.

When markets are quiet and most asset classes are generating solid returns with lower daily volatility, clients are generally happy and content. But when the economy has a problem and asset values get volatile, clients often begin to critique what they are invested in and whether each investment is still an appropriate choice for them. If clients do not fully understand and appreciate what they own and why, a wedge often creates created between them and their advisors. It’s times like today that revisiting the suitability and know your customer rules add the most value to everyone concerned. Using today’s uncertain world as the air-cover for catching up with clients is a wonderful way to service them, build deeper ties, and update investment portfolios. My general rule, when the client profile & suitability changes, so too must the portfolio recommendations & allocation weights.

Automating the discovery process can protect you & enhance your client relationship

As I stated earlier, every firm and advisor team has their own process for building an investor profile, storing the data, and updating the data over time. Because client sophistication and market knowledge tend to have a wide gap, I thought I would create a resource for advisors to use as a template for re-connecting on suitability metrics given clients’ current angst with investments & markets. The daily volatility we are seeing now can have a lasting effect on an investors willingness to take risk for goal achievement. The link below is meant to be used as a collaborative tool between the advisor and his/her clients on a 1-1 basis. How a client answers the 25 questions will paint a clear picture of: 1) their risk tolerances, 2) their return requirements, 3) their customer service preferences, 4) their time commitments, 5) their liquidity needs are, 6) what an appropriate mix between public and private alternatives might look like, and 7) what their behavioral temperament towards taking risk is. Once an advisor has this data, making sure they have the most prudent portfolio mix that matches back to their profile gets a lot easier. I can guarantee you, using something like the discovery process below will make it much easier for you to go line by line across an investment portfolio to spot-check if proper suitability is intact.  Whether you go through this assessment online together and I send you the results or you use what I have created as a general guideline, I hope you find the quick assessment helpful and useful.

One opportunity you will likely uncover: more clients would prefer to be shielded from the day-to-day volatility of traditional stocks, bonds, and in public markets. This might lead to deeper conversations about public and private market exposures that might be more suitable. The bonus: to have a less volatile ride along the way, clients are likely willing and able to give up some daily liquidity or to consider asset classes that offer less correlation to traditional stocks and bonds. And you get the opportunity to re-connect and build a more institutional portfolio.

Take me to the Investor-Advisor Profile Quiz

If you would like to discuss this Q&A assessment 1-1 with me, I’m happy to chat. My email is eric.clark@accuvest.com.

Disclosure:
This information was produced by Accuvest and the opinions expressed are those of the author as of the date of writing and are subject to change. Any research is based on the author’s proprietary research and analysis of global markets and investing. The information and/or analysis presented have been compiled or arrived at from sources believed to be reliable, however the author does not make any representation as their accuracy or completeness and does not accept liability for any loss arising from the use hereof. Some internally generated information may be considered theoretical in nature and is subject to inherent limitations associated therein. There are no material changes to the conditions, objectives or investment strategies of the model portfolios for the period portrayed. Any sectors or allocations referenced may or may not be represented in portfolios managed by the author, and do not represent all of the securities purchased, sold or recommended for client accounts.  The reader should not assume that any investments in sectors and markets identified or described were or will be profitable. Investing entails risks, including possible loss of principal. The use of tools cannot guarantee performance. The charts depicted within this presentation are for illustrative purposes only and are not indicative of future performance. Past performance is no guarantee of future results.